Average Screen Time by Age (2026)
"Average screen time" is a useless number until you know whose average. A 14-year-old and a 64-year-old both own a phone, and they are not living the same digital day. The headline figure that gets quoted everywhere, somewhere around five hours, hides a spread so wide that the average barely describes anyone.
This post breaks the number apart by age and generation. Every figure below is linked to the study it came from, with the year attached, because age data ages fast and a 2021 census is not a 2026 census. Where a clean per-segment figure does not exist, that is said plainly rather than filled in with a guess. If you want the overall picture across all ages, the 2026 screen time statistics breakdown covers totals, apps, and trends. This one is about the curve.
The screen time curve, by age
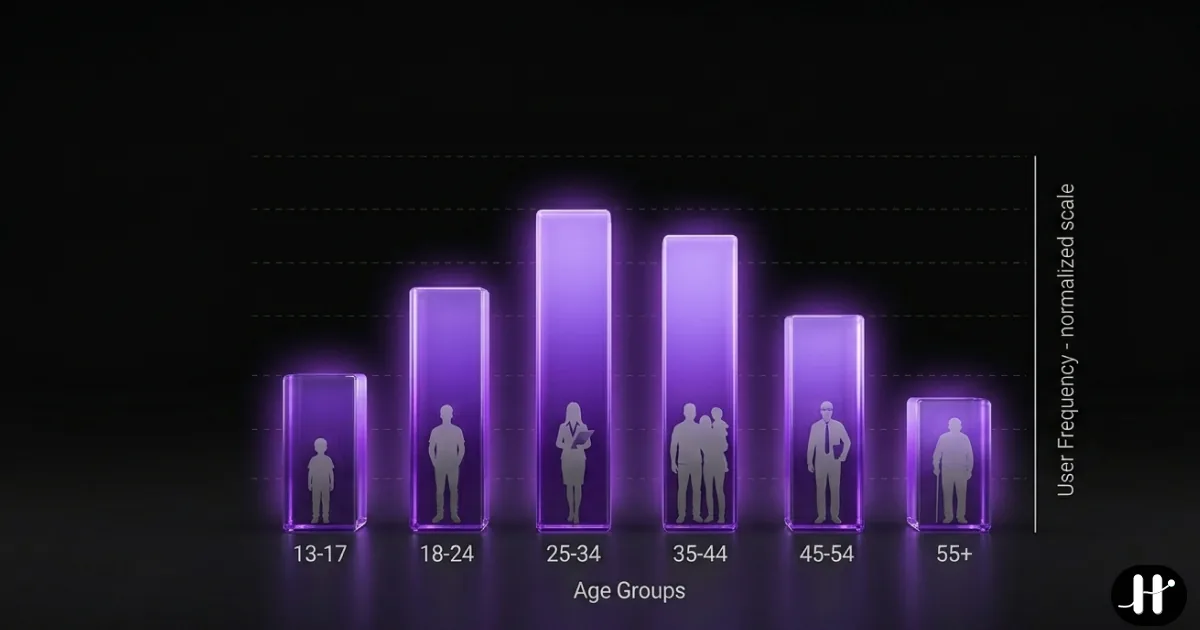
Read the segments together and a shape appears. Usage climbs through childhood, peaks somewhere in the teens and early twenties, then tapers with age. It does not fall off a cliff. A 60-year-old still spends hours a day on screens. But the heaviest users, by every measure, are the youngest adults and the oldest teens.
A caution before the table: these figures come from different studies using different definitions. Some measure phone-only time. Some measure all screens (phone, laptop, TV, tablet) added together. Some measure social media alone. They are not directly comparable cell to cell, so each row names exactly what it counts. Stacking a phone-only number against an all-device number is how the internet ends up with screen time stats that contradict each other.
| Age / generation | Figure | What it counts | Source | Year |
|---|---|---|---|---|
| Tweens (8-12) | 5h 33m/day | All screen media | Common Sense Media | 2021 |
| Teens (13-18) | 8h 39m/day | All screen media | Common Sense Media | 2021 |
| Teens (13-18) | 4.8h/day | Social media only | Gallup | 2023 |
| Young adults (18-24) | 8.1h/day | All devices | DataReportal | 2025 |
| Gen Z (adults) | 6h 27m/day | Phone only | Harmony Healthcare IT | 2024 |
| Ages 25-34 | 7.6h/day | All devices | DataReportal | 2025 |
| Ages 35-44 | 7.1h/day | All devices | DataReportal | 2025 |
| Baby Boomers (adults) | ~4h/day | Phone only | Harmony Healthcare IT | 2024 |
| Adults 60+ | 4h 16m/day | Leisure screens | Nielsen, via NPR | 2026 |
Kids and tweens (under 13)
Common Sense Media's 2021 census, the most cited primary source for this group, measured tweens aged 8 to 12 at 5 hours 33 minutes a day of screen media. That was up from 4 hours 44 minutes in the 2019 wave, a 17 percent jump across the early pandemic.
One caveat the report itself makes: this is entertainment screen media, not screens used for school, and a tween can run two screens at once, so it is not five and a half hours of undivided attention. It is total exposure. The figure is also four years old now. A 2026 update for this exact age band has not been published by the same source, so treat 5h33m as the best-sourced number available rather than a fresh one.
Teens (13-17)
This is where the numbers spike, and where they get measured the most carefully because the stakes feel highest.
The headline screen-media figure is 8 hours 39 minutes a day for teens aged 13 to 18 (Common Sense Media, 2021). That counts everything: video, gaming, social media, browsing, music with a screen on. It is the single largest daily activity for the average American teen, sleep included on some days.
Narrow it to social media alone and Gallup's 2023 survey found teens average 4.8 hours a day, with a clean age gradient inside the teen years: 4.1 hours at age 13, rising to 5.8 hours by age 17. Girls ran nearly an hour higher than boys (5.3 versus 4.4). YouTube and TikTok ate most of it.
The behavioral marker is just as telling as the hours. Pew found in 2024 that 48 percent of US teens say they are online "almost constantly," roughly double the share a decade earlier. At that level, "screen time" stops being an event you could count and becomes the default background state of the day.
Gen Z young adults (18-26)
Two angles, two sources, same conclusion: this band tops the curve.
On all-device tracking, DataReportal's Digital 2025 report put the global 18-24 cohort at 8.1 hours a day across phone, laptop, TV, and tablet, the highest of any age group it tracks. On phone-specific data, Harmony Healthcare IT's December 2024 survey of 1,001 US adults measured Gen Z at 6 hours 27 minutes a day on their phones alone, well above the 5 hours 16 minutes US adult average from the same study.
Gen Z grew up with the smartphone as a primary tool for social life, news, and entertainment all at once, so the line between online and offline that older groups still maintain is largely gone for this cohort. That is the structural reason the figure sits where it does.
Millennials and Gen X (late 20s through 50s)
Here the data gets thinner, and honesty matters more than a tidy table.
The Harmony Healthcare IT survey published exact phone figures only for its top and bottom generations (Gen Z and Boomers), not a clean Millennial or Gen X phone number, so inventing one would be guesswork. What is well sourced is the all-device curve by age band. DataReportal's Digital 2025 report shows daily time stepping down smoothly with age: 7.6 hours for the 25-34 group and 7.1 hours for 35-44, both below the 8.1-hour young-adult peak but still very high.
The takeaway for these mid-life bands is the slope, not a single magic number. Usage is lower than Gen Z's and higher than Boomers', and it declines gradually rather than dropping. Millennials in particular carry a heavy messaging and work-app load on top of social and streaming, which keeps the device central to the day even when pure scrolling time dips.
Older adults (50+)
The surprise of the age curve is the tail. It does not vanish.
Harmony Healthcare IT measured Baby Boomers at just over 4 hours a day on their phones (December 2024), the lowest of the four generations but far from negligible. Widen it to all leisure screens and Nielsen data, reported by NPR in 2026, shows adults 60 and older spending 4 hours 16 minutes of their daily leisure time on screens, more than half of all their leisure hours, mostly TV and video.
The trajectory is the headline here. DataReportal's Digital 2025 report notes that the 55-64 band increased its online time over the prior year even as some younger bands held flat. The same engagement mechanics that hooked younger users are reaching older ones on a delay, which is why screen overuse reads less like a generational quirk and more like a human one.
Reading the curve
Put the segments end to end and the shape is consistent across every measurement method. Screen time builds through childhood, peaks in the teens and early twenties, then tapers through middle age and into older adulthood without ever bottoming out near zero. The youngest adults and oldest teens are the heaviest users by a clear margin. The decline with age is real but gentle, and the oldest group is the one rising fastest in percentage terms.
A few honest caveats worth carrying out of this:
- Definitions drive the gap. All-device totals run higher than phone-only figures, which run higher than social-media-only figures. When two screen time stats clash, check what each one counts before assuming one is wrong.
- Self-report runs low. Survey figures tend to undershoot measured device data, because people underestimate their own use. For the count side of this (how often, not how long), the phone-check statistics by year post tracks the measured-versus-reported gap directly.
- The averages hide tails. In every band, a heavy minority sits far above the mean. Common Sense Media found 26 percent of teens log more than 8 hours of screen media on a given day. The average flattens those people out.
If you are above your age average
Knowing your number only matters if it changes something. If your daily screen time sits above the figure for your age band, the useful question is not "how do I feel less guilty" but "what is the time being spent on, and could some of it be earned instead of automatic."
The honest answer for most people, across every age group, is that the bulk of the overage is not deliberate. It is the automatic open: the reflexive tap into a feed during a dull moment, repeated dozens of times a day until it adds up to hours. You do not decide to spend 6 hours on a phone. You decide a hundred times to spend three minutes, and the count does the rest. For how to think about thresholds rather than chasing a number, see how much screen time is too much, and for a quick gut-check on whether your use has crossed into a problem, the phone addiction self-check.
The fix that tends to hold is not a stricter limit you can dismiss with one tap. It is changing what the automatic reach lands on.
Where Habit Doom fits
Habit Doom is built for exactly that. It is an iOS app that locks your chosen distraction apps, the ones the data shows eat the most of your day, until your daily habits are checked off. The reach still happens. But the app the reflex was reaching for is locked at the system level, so the automatic open resolves into nothing instead of a forty-minute scroll. Screen time becomes earned screen time: do the habit, unlock the feed.
The core app is free: up to three habits, app blocking, custom alarms, streaks, and on-device Anti-Cheat photo verification, no payment required. Pro adds unlimited habits, Hard Mode, and analytics at $2.99/month, $19.99/year with a 3-day free trial, or $49.99 lifetime. No ads. It is iOS only.
Your age band's average is a useful mirror. Whether you land above or below it, the lever is the same: stop the automatic open, and the hours follow.
Frequently Asked Questions
Keep Reading
Try Habit Doom
Lock your distracting apps. Complete your habits. Earn your screen time. It takes 30 seconds to set up.